Drilling Down on the Data: What the Numbers Say & Mean
The why, who, what, where & when’s
of Wellfleet pond monitoring
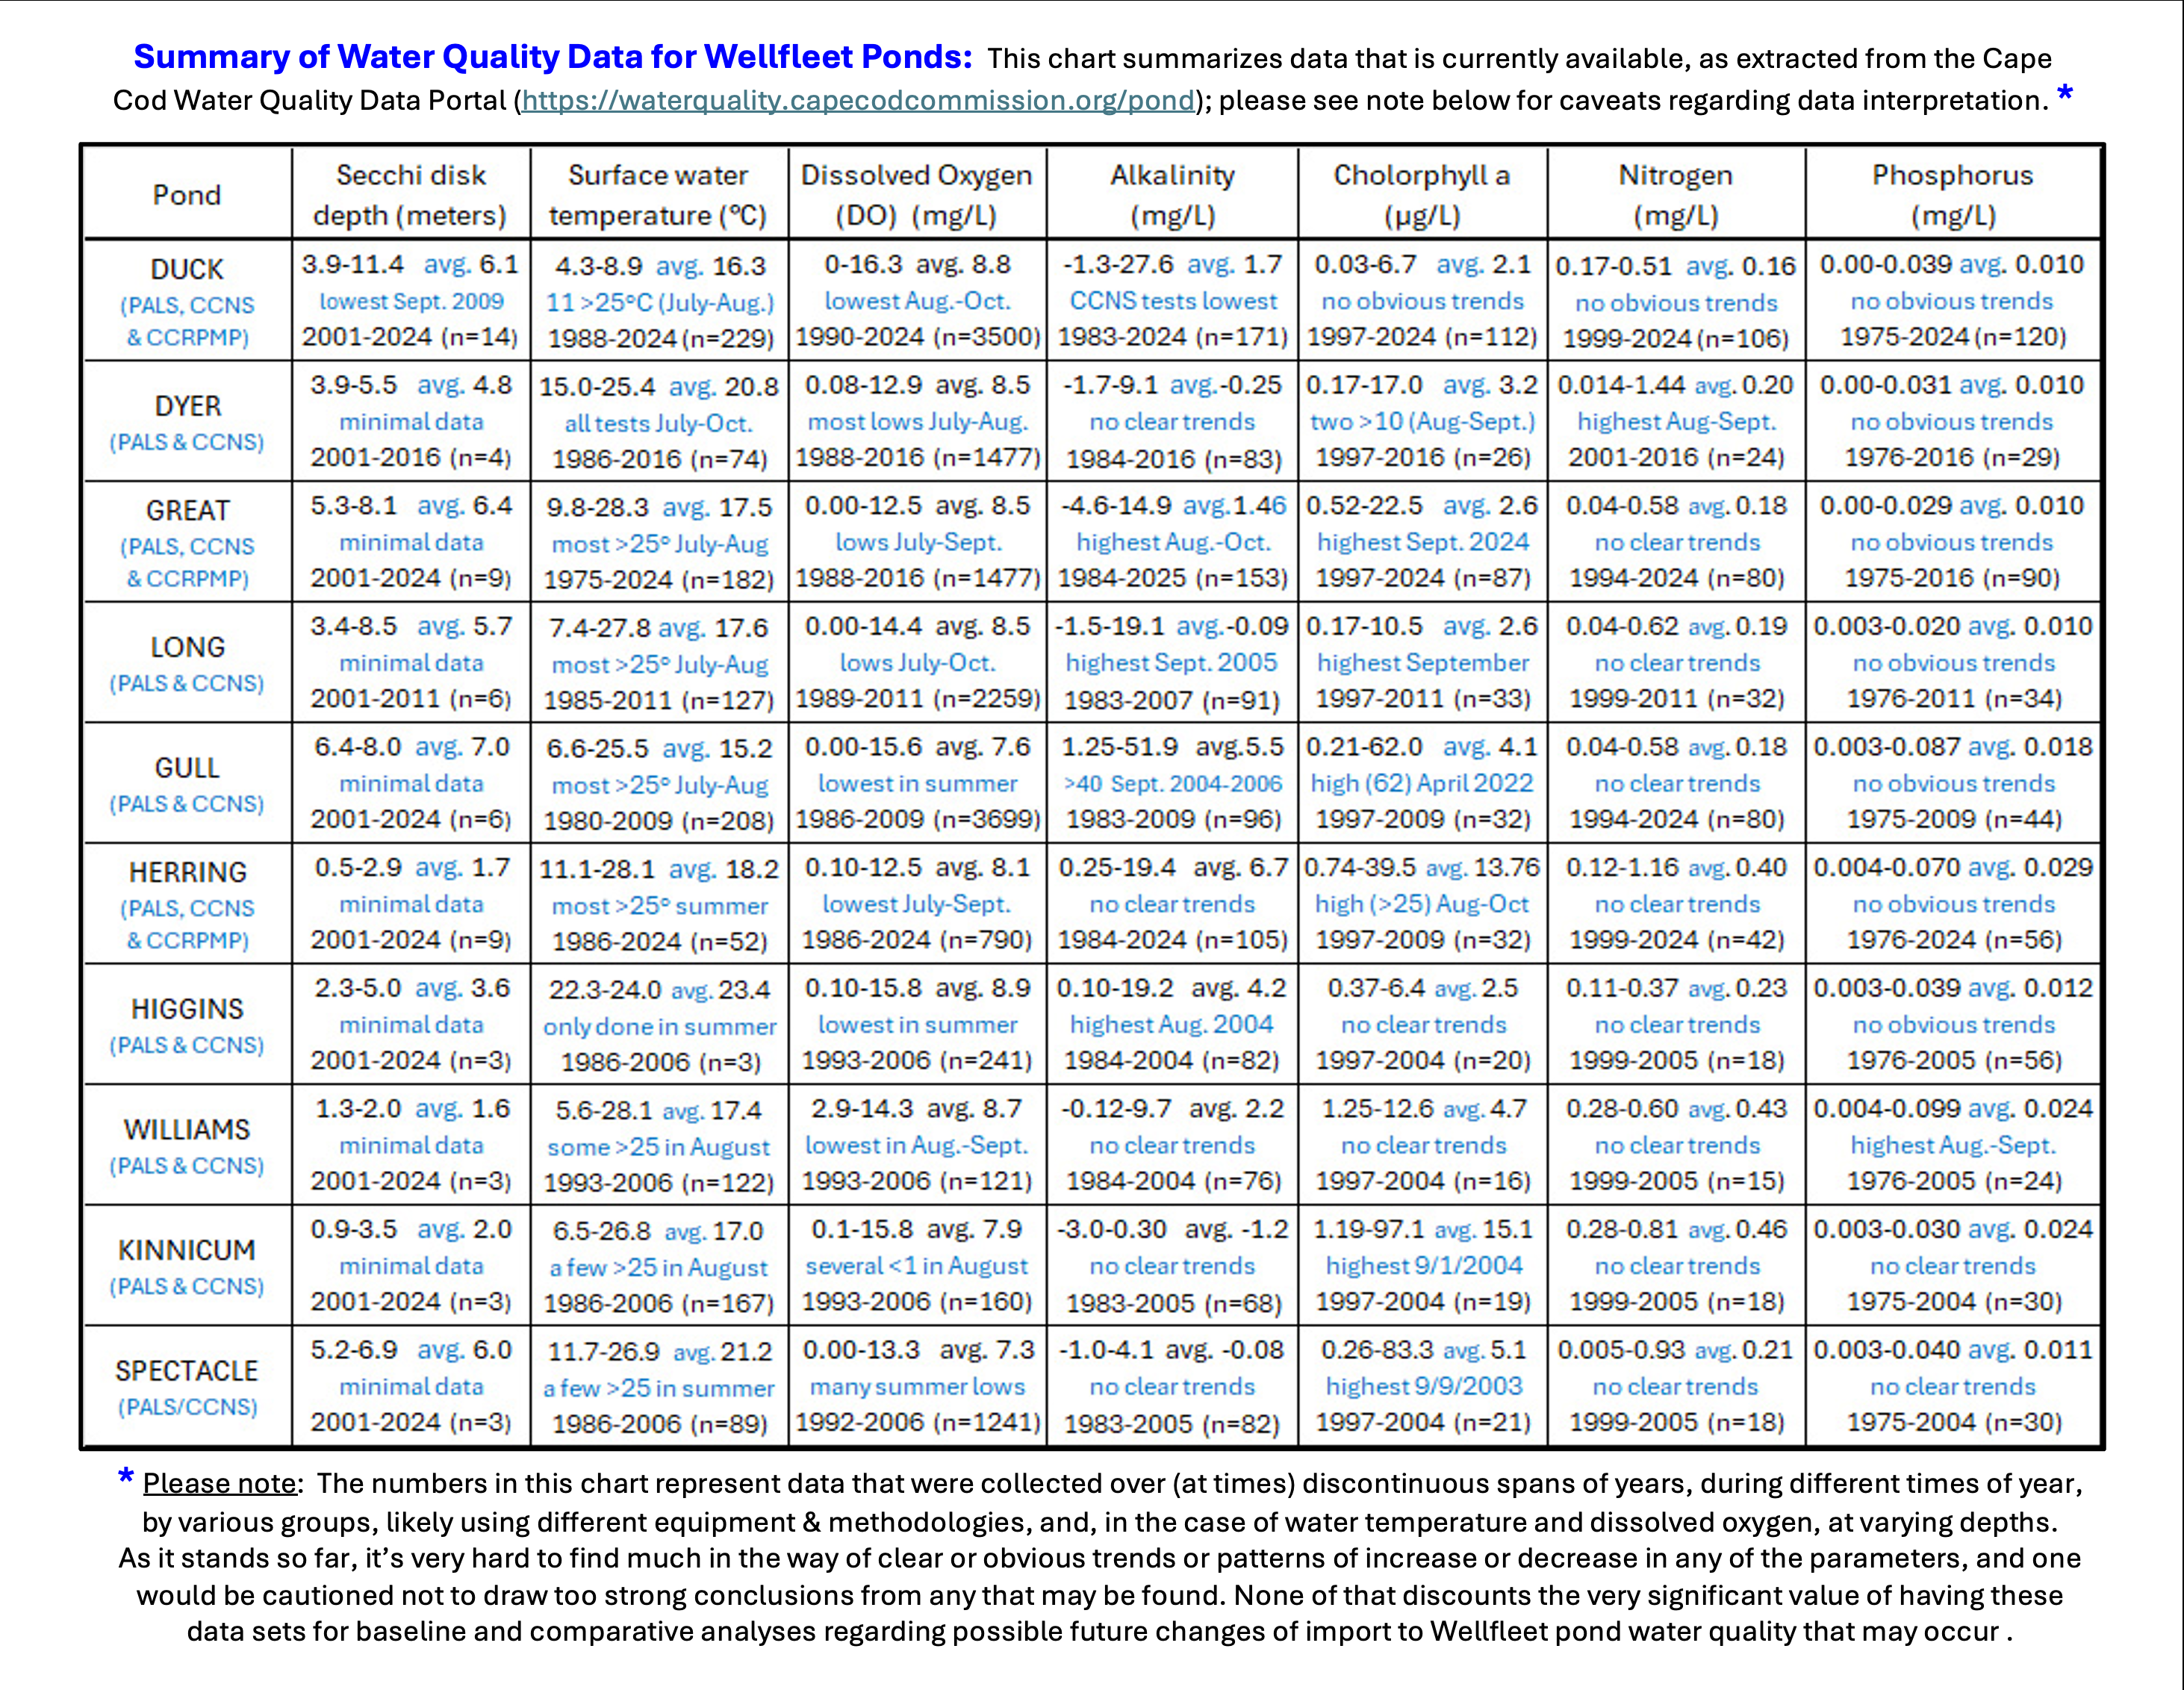
A robust history of monitoring water quality on Cape Cod ponds exists, with Wellfleet ponds – due to the National Seashore’s early and ongoing involvement – providing one of the longest and most consistent data bases in the U.S. The chart below summarizes what’s been done thus far.
Where to find the data referenced in the charts to follow
The links below access charts that were compiled to summarize data pertaining to Wellfleet ponds that was extracted from the Cape Cod Commission’s Water Quality Data Portal. These data encompass three different monitoring programs, five decades and over 54,500 data points.
In an attempt to put the numbers you’ll find in those charts in perspective – and offer a framework for interpreting how those numbers relate to the water quality world of our ponds – a series of pages featuring information and graphics on each of the water quality measures follows.
Current Water Quality Monitoring Programs for Wellfleet Ponds (as of June 2026)
Impacts of nutrients on pond health and aquatic life
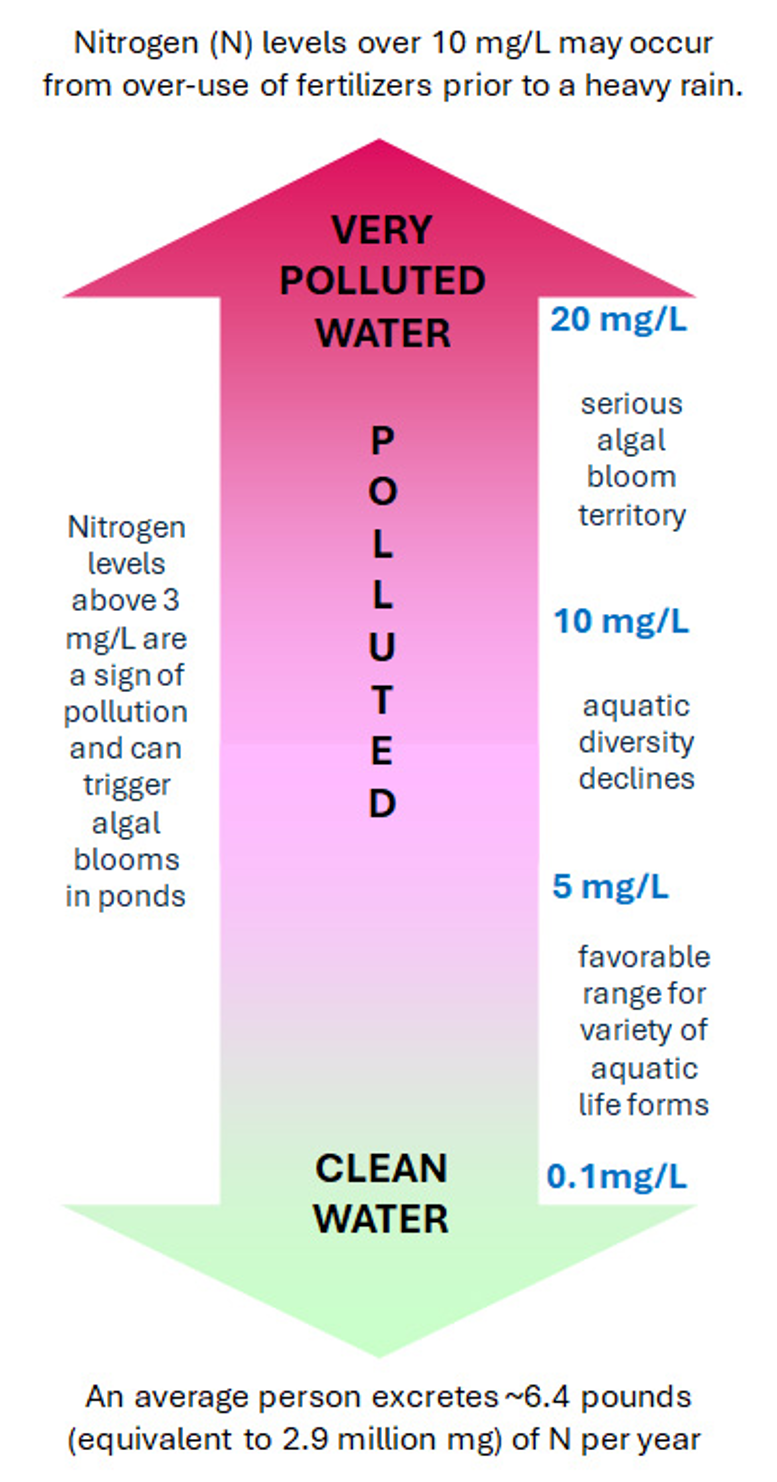
Whenever one references water quality issues on Cape Cod, the topic of nutrients will be front and center, with nitrogen and phosphorus being the key buzzwords. Anyone who does any gardening knows the value of these nutrients in stimulating plant growth, and the same is true for their impacts on plant life in our ponds. As with many things, a little bit of this can be a good thing, but too much is not. Although the usual mantra is that nitrogen is the key limiting nutrient in saltwater and phosphorus in fresh, it’s important to realize that both can trigger harmful algal blooms and associated water quality degradation in either of these environments.
Sources of these inputs are many and well-documented: runoff from lawns, farm fields, golf courses and other fertilized land areas, leaching from cesspools and poorly-maintained septic systems, animal wastes and other non-point sources. When inputs of nitrogen from any of these sources reach levels of 1 mg/L or more in our ponds, the chances of it promoting an algal bloom are greatly increased, with consequent impacts on aquatic life via reduced water clarity and DO levels. Limiting the sources of these inputs is key to preserving pond water quality.
Nitrogen in Wellfleet ponds
Monitoring data for all Wellfleet ponds indicate average total nitrogen levels falling well within acceptable 0.1 to 6 mg/L Massachusetts guidelines for surface waters and showing no clear trends in seasonal or over-the-years analyses.
Averages of all shallower pond data for all years (around 0.40 mg/L) were about twice as high as that in deeper ponds, with all averaging within acceptable level ranges. A few isolated, higher-than-usual (>1 mg/L) data points stood out in the data base – one in Dyer (8/11/1999) , and the other in Herring (9/22/2004), but it’s hard to speculate whether either one reflected any water quality issues.
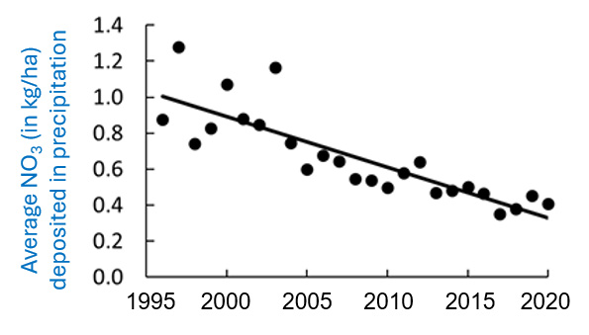
NEAT NEWS ON NITRATES
Not that long ago, pollution from automobile exhausts carried a fair bit of nitrogen as nitrate into the air, which combined with water in the atmosphere to rain down as acid in our ponds. Fortunately, improved emission standards over recent decades have greatly reduced these inputs, as the graph below clearly indicates.
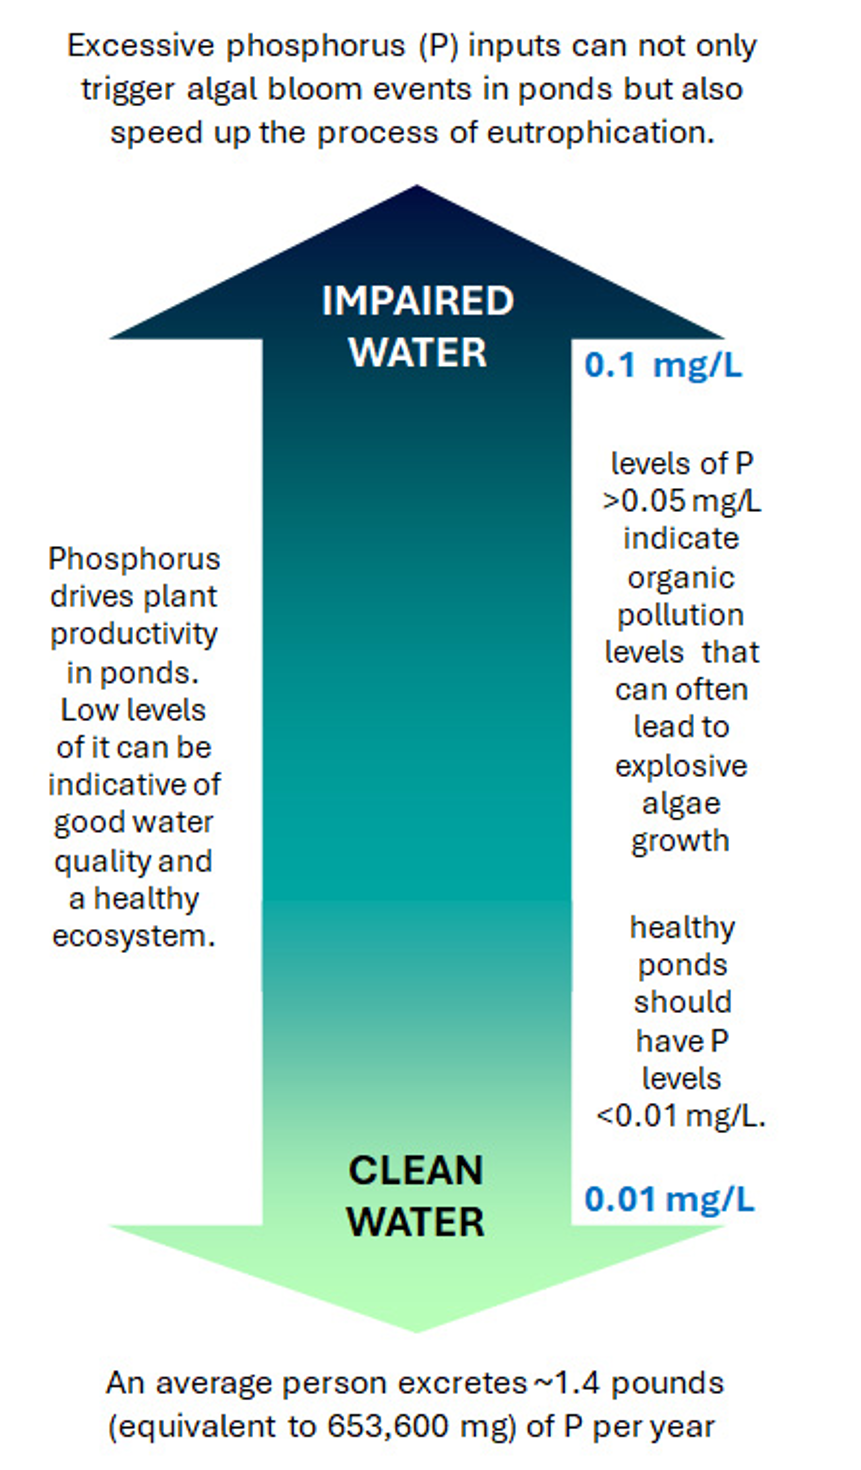
As the primary limiting nutrient to algal growth in freshwater, phosphorus is not only the best indicator of plant productivity in ponds, but also the key instigator of algal and cyanobacteria blooms in them. Over time, phosphorus measurements can also serve as a useful barometer for assessing where a pond falls in the oligotrophic-mesotrophic-eutrophic spectrum and whether the pond is increasing, decreasing or holding stable with respect to nutrient inputs from its surroundings.
These inputs are similar to those of nitrogen, but even more strongly associated with wastewater from poorly-designed and/or maintained home septic systems. In addition to the human waste elements, the phosphorus component of laundry detergents and cleaning supplies can contribute to the problem, so choosing to use “green” options that carry minimal amounts of P can make a difference.
Phosphorus in Wellfleet ponds
Analysis of data available to date for evaluating phosphorus levels in Wellfleet ponds show no clear trends or patterns of increase or decrease. A few higher-than-the-healthy-threshold-of 0.03 mg/L episodes have been reported for some of the ponds (typically in August and September) but were hardly frequent enough to draw any inferences from them.
For most of the time, phosphorus is bound by pond bottom sediments – but whenever extended late-summer into early-fall thermal layering leads to anoxic conditions at the bottom, that phosphorus can be released into the water column, with potential for triggering algal bloom events.
Ongoing monitoring and management of P inputs will be needed to maintain high water quality in Wellfleet ponds.
POND-ERING THE ‘P’ IN PHOSPHORUS
The chemical symbol for Phosphorus (P) presents an ironic context for two of the troublesome sources of algal-bloom-inducing phosphorus-loading in our ponds. Yes, we’re talking about: Pee – from those who choose to do so while swimming in the pond* and Poop – from dogs (and sometimes horses) that are allowed to do their business in and around the ponds.
Of course, that’s not the only way that P from pee and poop can over-fertilize our Wellfleet ponds. The prevalence of cesspools and septic leach fields from homes bordering the ponds presents an even bigger challenge that will need to be addressed to preserve and protect the quality of Wellfleet ponds for prosperity.
* up to 70% of the P humans excrete is in the form of Pee! Message: it’s really not OK to pee in the pond!
Water temperature
Please note: the above arrow graphic, and those on the pages to follow, were adapted from volunteer monitoring materials developed by the Delaware Adopt-a-Wetland Program. The graphics content has been updated to fit the Cape Cod pond environment.
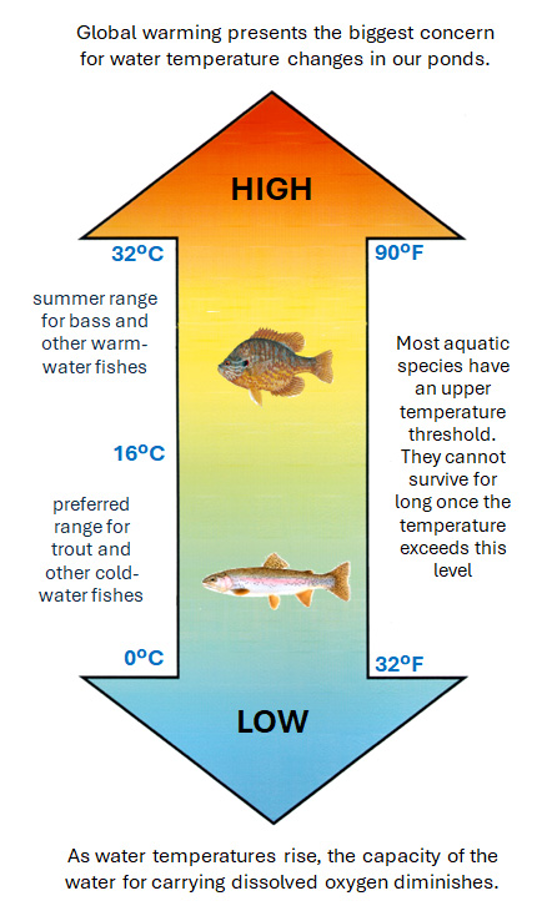
Impacts of water temperature on pond health and aquatic life
Most aquatic creatures have adapted to live within a certain temperature range and undergo physiological stress when exposed to temperatures outside of that range. Water temperatures above 25°C (77°F) can be especially stressful for many aquatic life forms and prolonged exposure to conditions above that can even be lethal.
Temperature also affects the amount of dissolved oxygen (DO) in the water. Warm water holds less DO than cold water, so if a pond should get too warm in summer, organisms may face the dual stresses of higher temperatures and low oxygen levels at a time in their life cycle where they need to grow, mature and reproduce
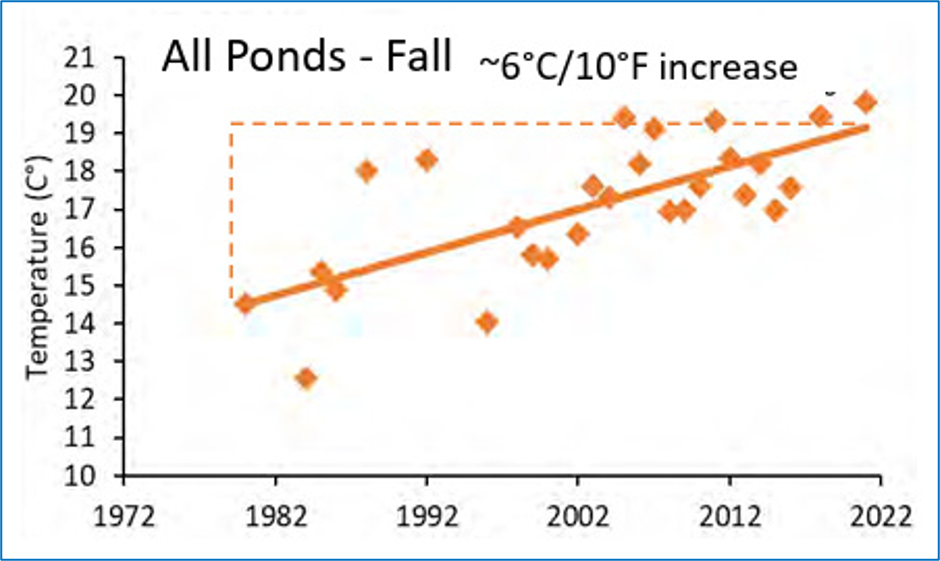
Taking the temperature of Wellfleet ponds
Through much of their monitoring history, Wellfleet ponds showed highly variable ups-and-downs in water temperatures from year-to-year. But since 2010, National Seashore scientists have documented a consistent warming trend, with average summer water temperatures rising 2°C over that span (as the graph below illustrates).
The increasing trend of higher water and air temperatures in and around our ponds is concerning, but not something we, as caretakers of the ponds, can easily impact.
What we can do is better manage the inputs of nutrients to the ponds, which – in concert with warming temperatures – are two key factors in triggering harmful cyanobacteria blooms.
Although this may not seem like much in terms of levels harmful to pond life, the changes can have various sublethal effects on the life cycles of many species and the diversity and balance of the pond community.
FOR YOUR ‘POND-ERING’
A key side effect of warming water temperatures in our deeper Wellfleet ponds has been a lengthening of the duration and depth to the normal summer and winter thermal layering regime. This can increase the frequency of harmful algal blooms in the ponds.
Dissolved Oxygen (DO)
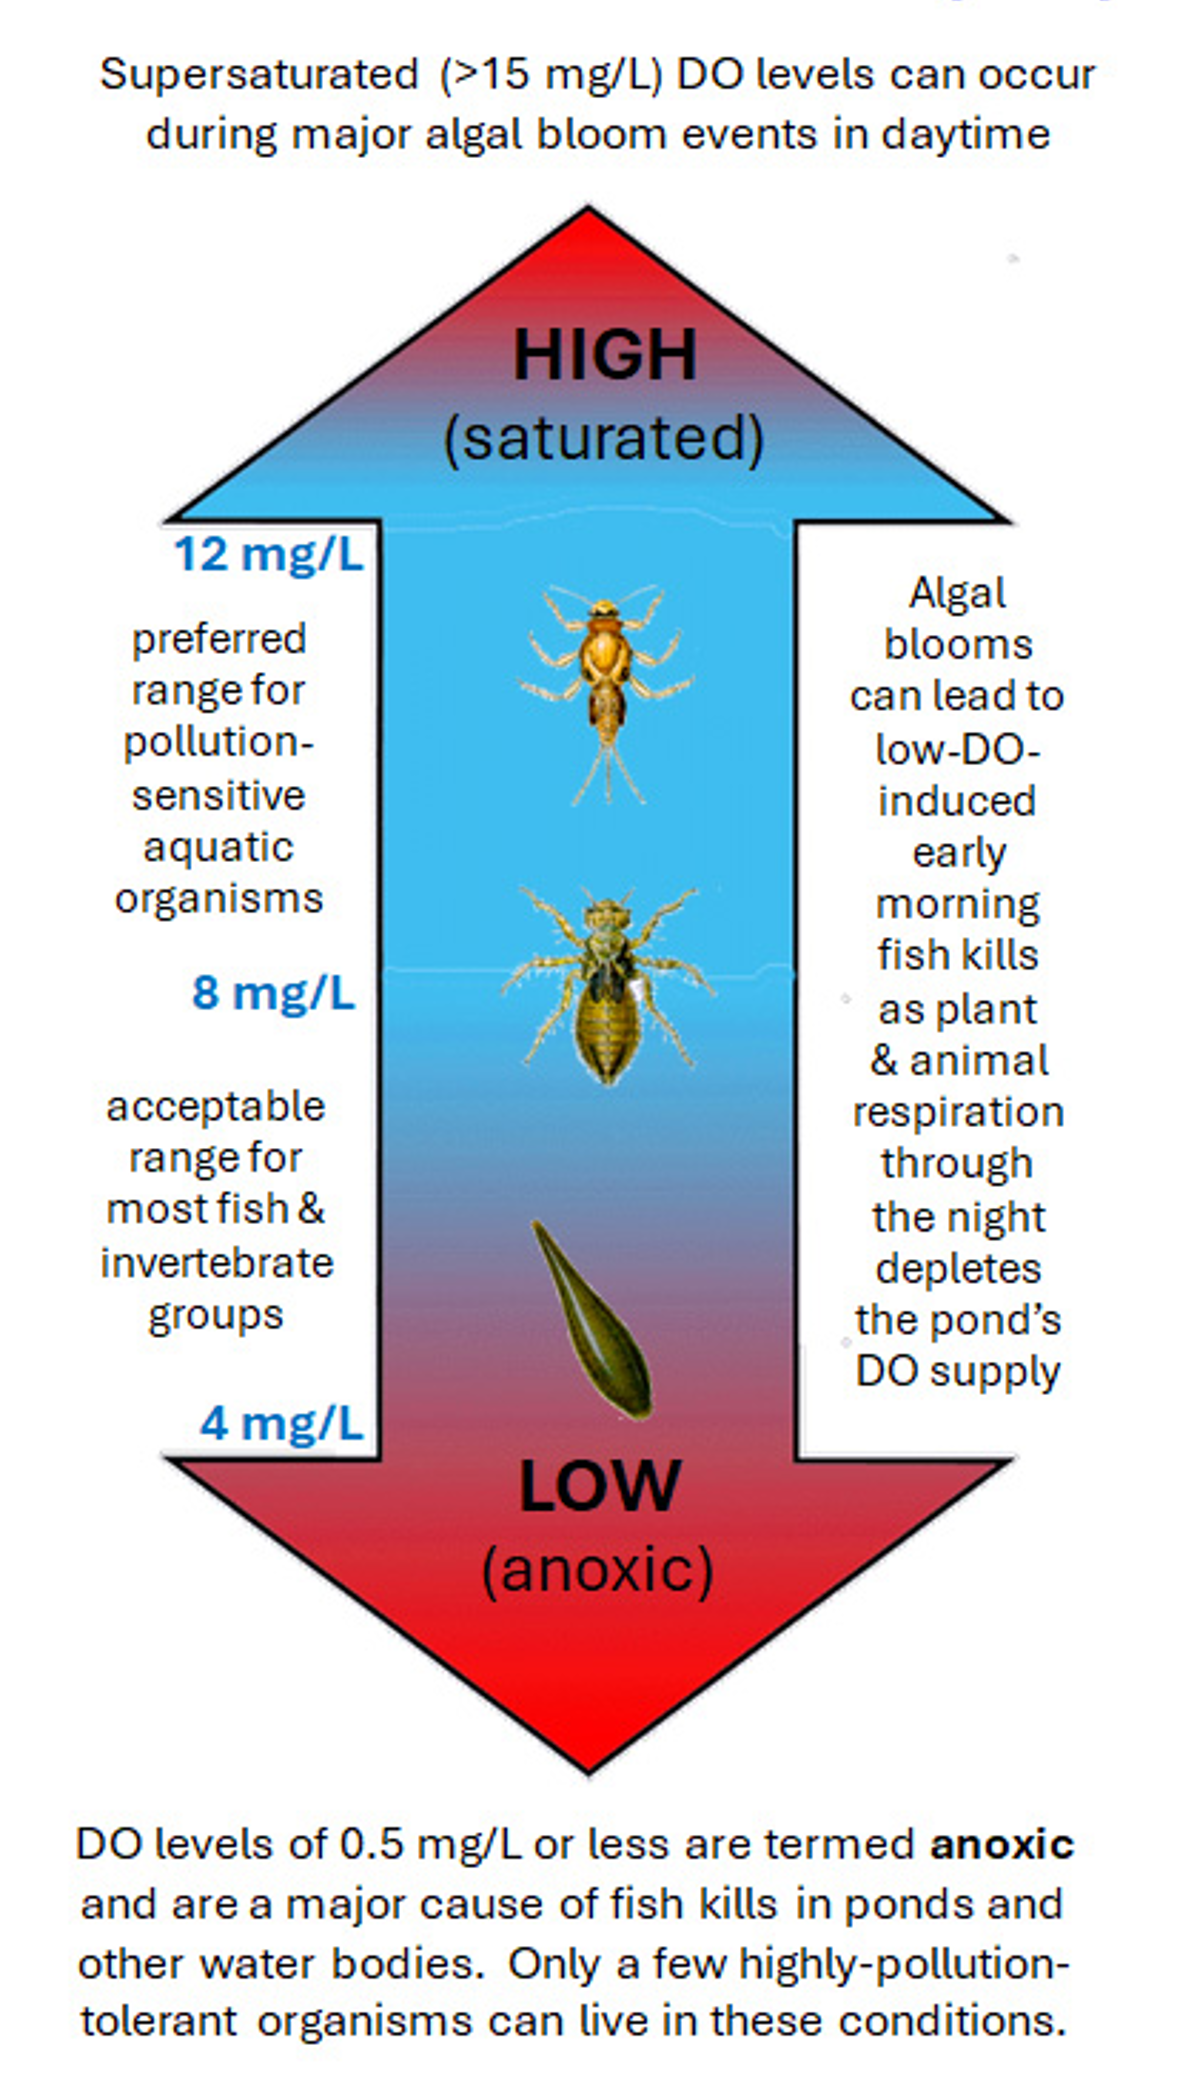
Impacts of dissolved oxygen on pond health and aquatic life
Oxygen is as vital to the health of aquatic life as it is to creatures living on land, and aquatic plants and animals have adapted various ways of obtaining it. The gills of fish and many aquatic invertebrates take in oxygen dissolved in the water – hence the term dissolved oxygen (DO) – and pass it into their bloodstream, where it can be used by muscles and organs. Some animals absorb oxygen directly through their skin; others have special appendages for taking in air from above the water surface; and still others have adapted ways of carrying it with them to meet their underwater oxygen needs.
The amount of DO available to aquatic animals varies with water temperature, weather and time of day. In daylight, DO levels typically rise as aquatic plants produce oxygen by photosynthesis. At night, plants consume oxygen as they respire and DO drops. This can happen in the aftermath of algal blooms, when populations crash and masses of dying material fall to the bottom, resulting in microbes using up DO in decomposing them. Organic pollution from wastewater can also deplete DO in the same way and greatly limit the kinds and diversity of pond organisms adapted to living in those conditions.
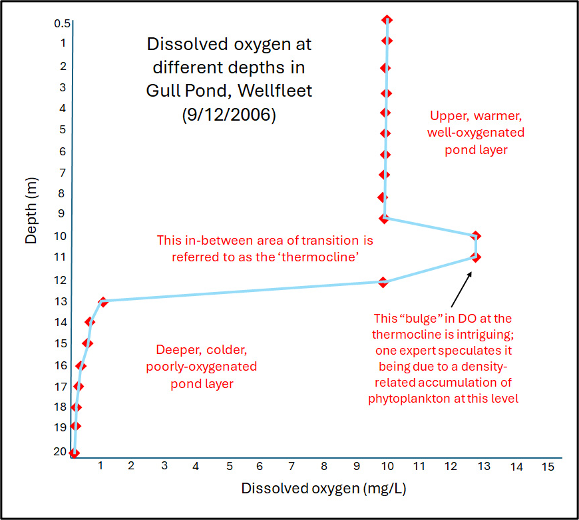
So, how are Wellfleet ponds DO-ing ?
All Wellfleet ponds show consistently acceptable DO levels for aquatic life and satisfy state limits of 6 mg/L and 5 mg/lL for cold and warm-water ponds respectively.
The exception to this occurs in some of our deeper ponds in mid-to-late summer, when the thermal layering cuts off the mixing of the well-oxygenated warm-water layer above from the colder layer below.
Anoxic (zero DO) zones can develop near the bottom of these ponds, prompting cold-water-adapted fish, such as trout, to move to the upper water zone, where they face stress and can die from warmer conditions.
Fortunately, as pond waters remix in the fall, the temperature layers break down, replenishing oxygen supplies to the deep-water zones.
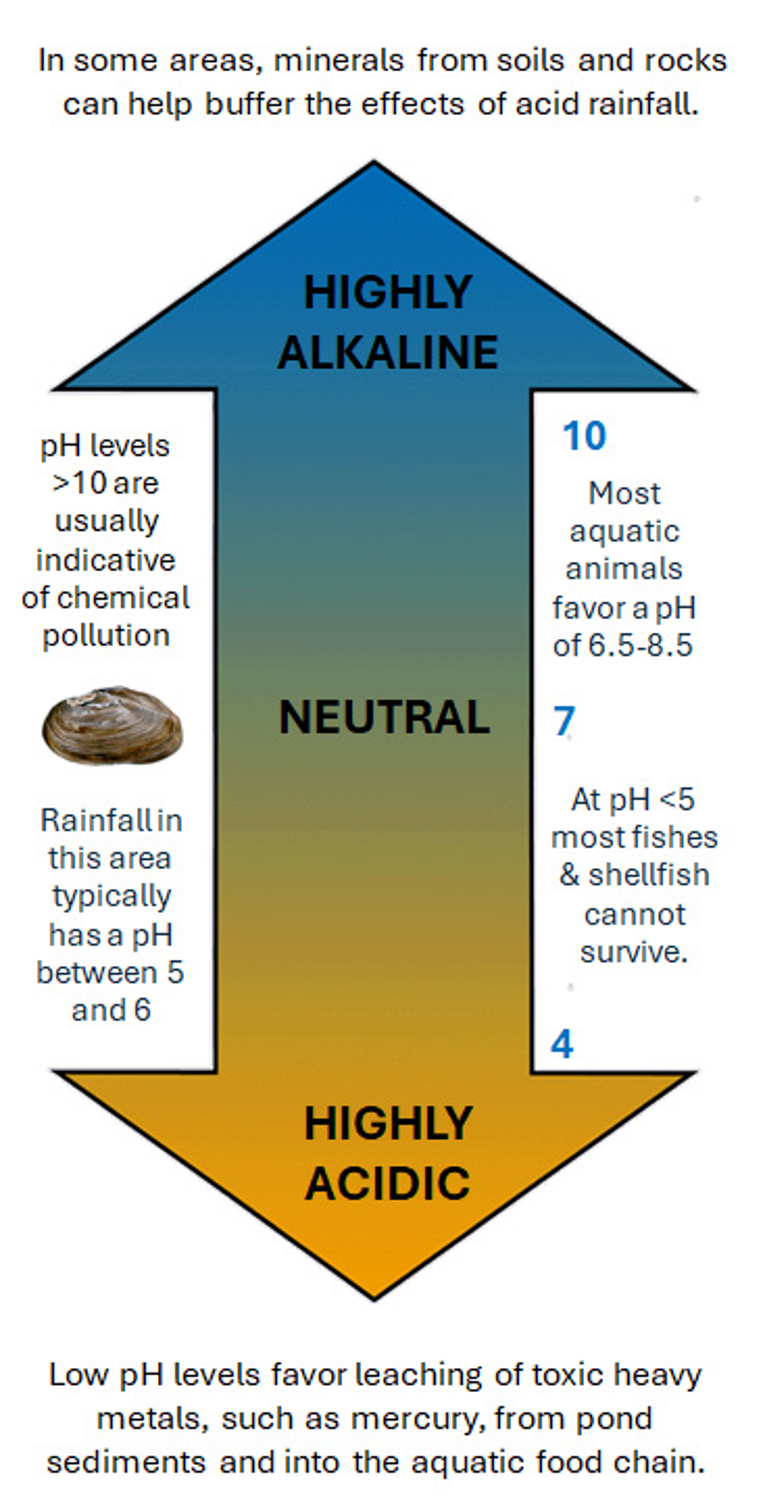
pH – as a measure of acidity – serves as a key water quality indicator for a healthy pond ecosystem.
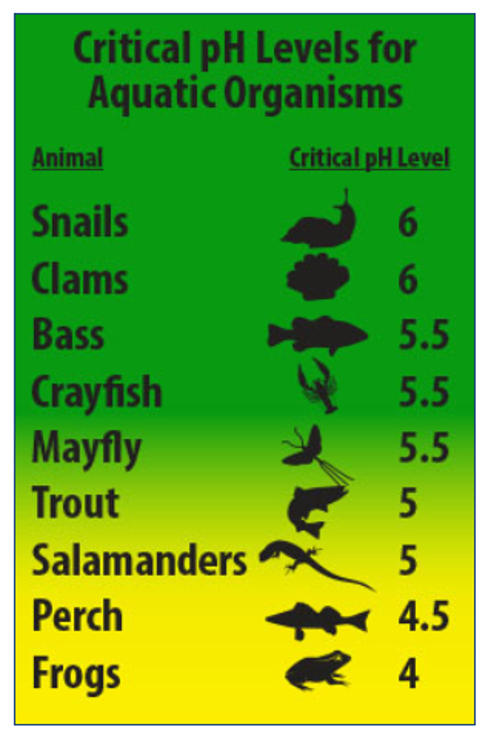
The pH range of most natural aquatic systems typically falls between 6 and 9. This level provides favorable conditions to a healthy variety of life forms, though some organisms can tolerate levels slightly above or below it.
The accompanying graphic illustrates tolerance thresholds for some common pond animals. Low pH waters can hinder many fishes’ ability to lay eggs successfully and weaken bones in the adults. Acid water can also dissolve the shells of crayfish, snails and other aquatic invertebrates.
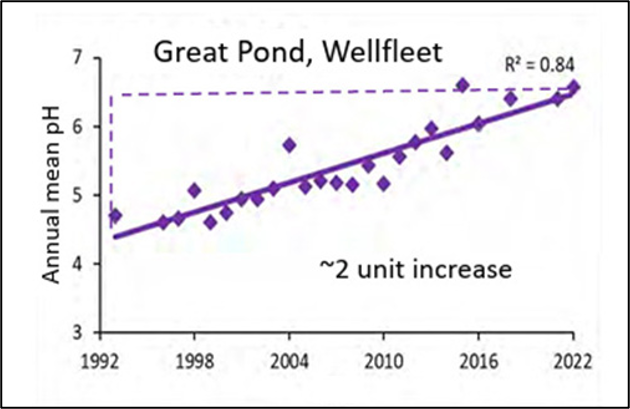
Thanks to the impacts of the Clean Air and Water acts of the 1970’s, significant reductions have been achieved in recent decades in pollution sources that feed the acidity of rainfall reaching our ponds.
As a result, all Wellfleet ponds – as shown in the graph above – have seen dramatic increases in pH over the last 30 years, making them less acidic and more hospitable to supporting a higher diversity and productivity of aquatic life.
pH is measured on a scale of 0 to 14 with the lowest end representing extremely acidic and the higher the most alkaline (non-acidic) levels.
But what distinguishes pH from other water quality measures is that the scale is logarithmic. This means that an increase or decrease in one number on the pH scale indicates a 10-fold change in the acidity level measured. So when we talk about Great Pond going from a pH of 4.5 thirty years ago, to 6.5 today, we’re pointing to an acidity level that’s 100 times lower. How GREAT is that?
Alkalinity
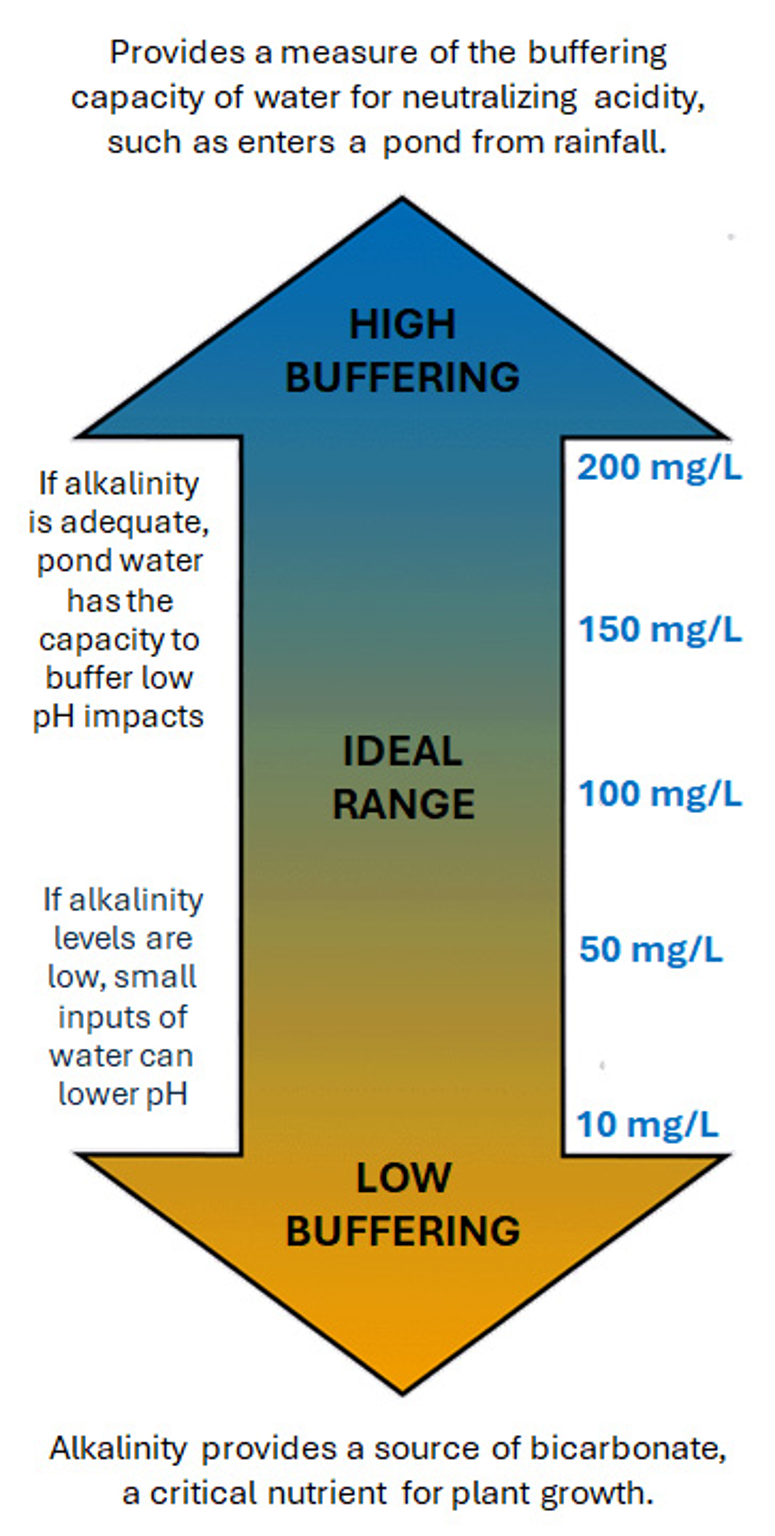
Alkalinity impacts on pond health and aquatic life
Alkalinity is a measure of the capacity to buffer any acidity present in the pond water. As such it has a major impact on pH, though it should not be viewed as a measure of it. Healthy ponds should have some measurable level of alkalinity, preferably in the range of 50 to 150 mg/L. Ponds with low alkalinity lack the ability to respond to any large or rapid changes in pH, leaving fish and other animals more vulnerable to the negative effects of the acidity. Those with alkalinity levels below 20 mg/L are more likely to have no fish or ones displaying stunted growth rates. Higher than normal alkalinity can also reflect higher levels of algal production, including potential for bloom events.
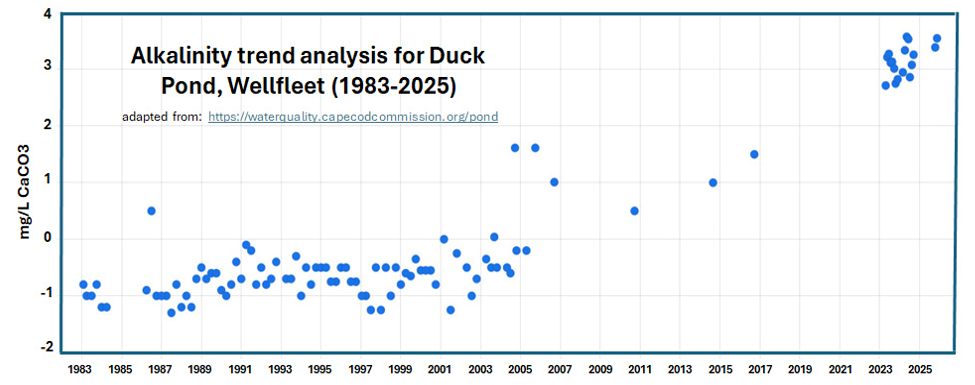
Alkalinity is trending upwards in Wellfleet ponds!
Increasing alkalinity offers a dual-edged interpretation. Good news for a pond’s capacity to buffer acidity. Not so good at high levels in reflecting elevated algal production.
In case you’re wondering how there can be negative data points in alkalinity, such values indicate that the capacity of pond water to buffer acidity was working at a deficit at those times.
Put another way, the pond had nothing left in its tank to neutralize the acid inputs it received. Thankfully that aspect of our pond’s water quality is looking up these days!
MINISCULE MEASURES
You may have noticed that many measures of water quality are given in mg/L (milligrams per liter) or ppm (parts per million). In terms of the concentration of the substance being measured, both units equate to the same thing: very small amounts of a specific component mixed in with a very large volume of water.
To put this in context, one ppm or mg/l would be equivalent to:
mixing 4 drops of ink into a 55-gallon barrel of water
spending one minute in a span of two years of your life
one car in a line of bumper-to-bumper traffic from Ohio to CA
The upshot of all this is that a very tiny increase or decrease in any of these water quality measures can have a huge impact on the health of a pond and its creatures.
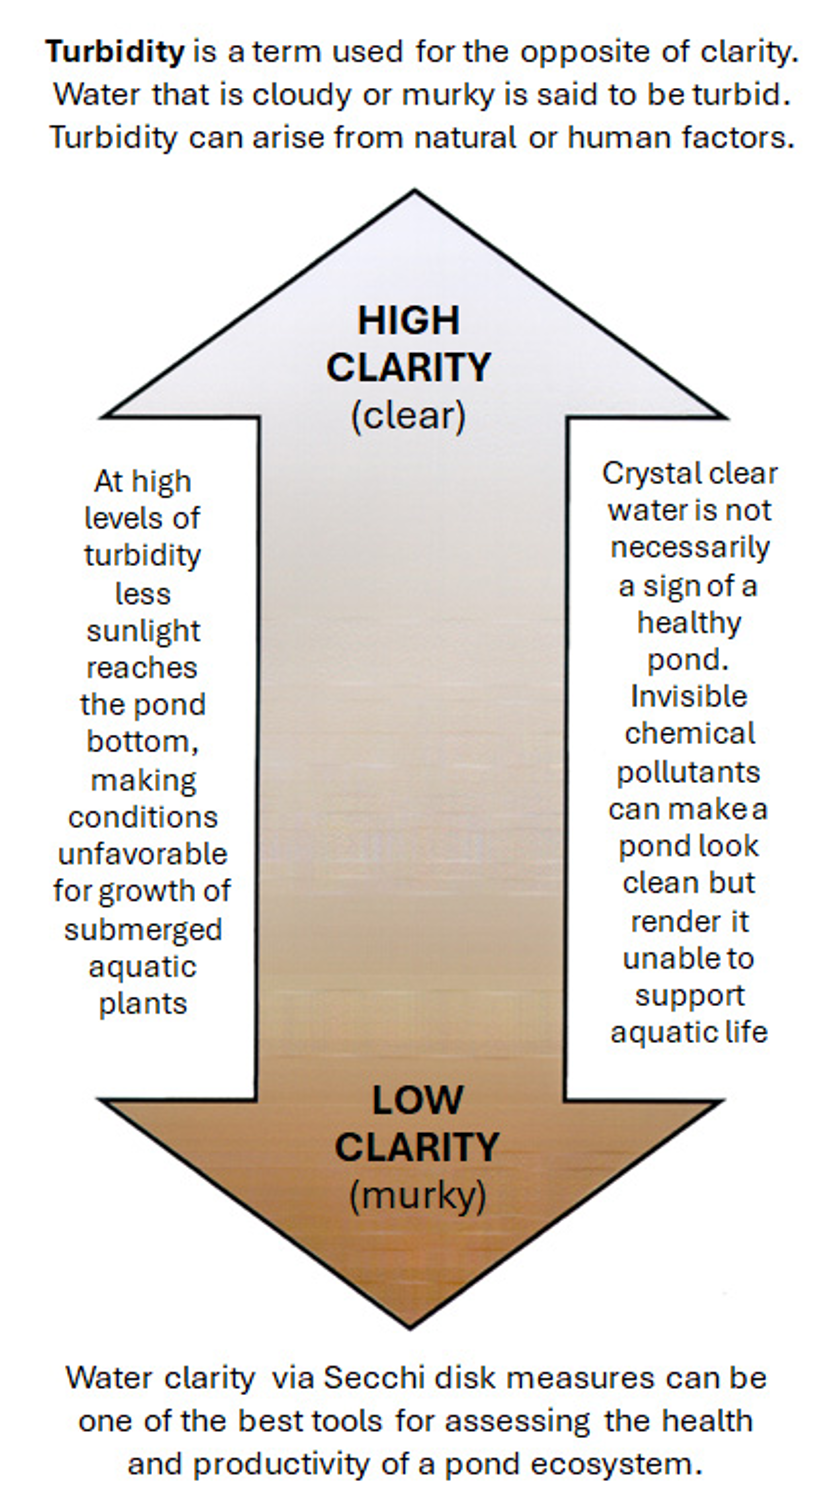
Water Clarity
A CLEARLY COOL INVENTION
Water clarity in ponds is measured by a neat gizmo called a “Secchi disk.” This device can tell us much about the health of a pond, such as the depth at which light penetrates for supporting plant growth, and how nutrient-enriched or polluted a pond is.
As with other water quality measures, the level of clarity in a pond can be affected by both natural and human influences and can be highly variable. Rain and wind can stir up the bottom sediments and reduce clarity, as can bottom-feeding fish. Erosion from pond-bordering hillsides and concentrated algal blooms can also reduce clarity.
When poor water clarity is prolonged – from whatever the cause – it can have a negative impact on the growth of submerged aquatic vegetation (SAVs) and the community of life they support.
Secchi disk being lowered into water to measure clarity
How clear is the water in Wellfleet ponds?
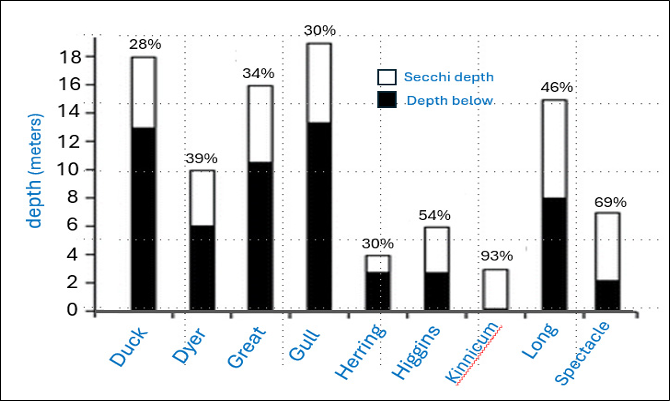
A recent report from Cape Cod National Seashore (CCNS) scientists describes water clarity in Wellfleet ponds as holding stable to slightly increasing over the last 20 years. The chart below (adapted from a 2017 CCNS report) conveys a ‘snapshot’ of average water clarity in relation to depth for selected Wellfleet ponds in August of 2013-2014.
Means of August 2013–2014 Secchi depths relative to pond depth. % values indicate Secchi depth as a percentage of pond depth. (adapted from: www.researchgate.net/publication/321737180)
A key takeaway from this report was that times of increased fish activity in the ponds – such as trout stocking in Gull Pond and spring herring spawning runs in the Gull Pond chain – seemed to have no adverse impacts on water clarity. The lower Secchi disk readings in Higgins and Herring were attributed to their shallower depths.
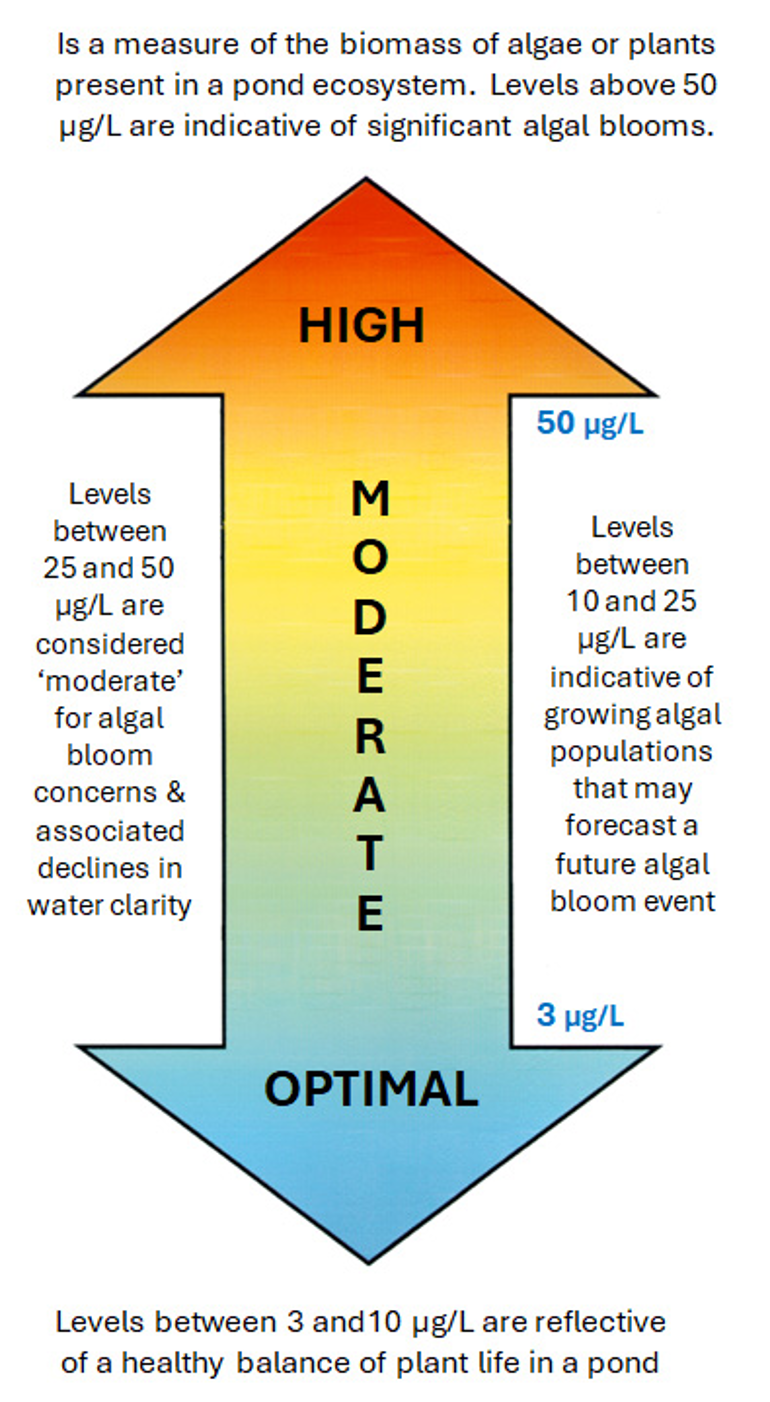
Chlorophyll a
What Chlorophyll a levels can tell us about pond health and aquatic life
Chlorophyll a is the primary photosynthetic pigment of algae and other aquatic plants. The level of it in a pond at any time reflects the amount of phytoplankton biomass, which tends to be elevated when nutrient loading is high. As such, periodic monitoring of chlorophyll a provides a helpful tool for assessing whether algae levels in a pond are stable, decreasing or increasing, making it a helpful predictor of algal bloom potential.
The National Lakes Assessment uses measures of chlorophyll a levels to classify the productivity condition of water bodies as oligotrophic, mesotrophic or eutrophic and to determine if a pond or lake is in good, fair or poor biological condition. Chlorophyll-a can also serve as an indicator for cyanobacteria blooms but is not diagnostic for it.
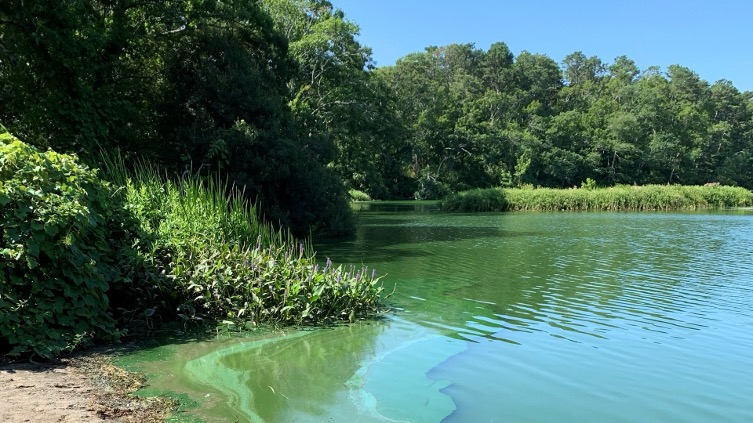
A typical high chlorophyll a algal bloom in a Cape Cod pond
The preponderance of all water quality monitoring data from Wellfleet ponds shows relatively low levels of chlorophyll a, with numbers trending in a slightly decreasing direction in recent years.
This is especially the case with our larger, deeper ponds, where measurements above 25 μg/L are rarely observed. Shallower ponds show higher average levels, including isolated episodes of algal-bloom elevated concentrations that occasionally happen in late summer/early fall.
FOR YOUR ‘POND-ERING’
If you thought mg/L stood for a small amount of potent stuff, consider the μg/L units used for measuring chlorophyll a.
This translates to micrograms per liter or one part in a billion. Think of one drop of ink in a large tanker truck full of water, and that’s what one μg/L of chlorophyll a amounts to!
